|
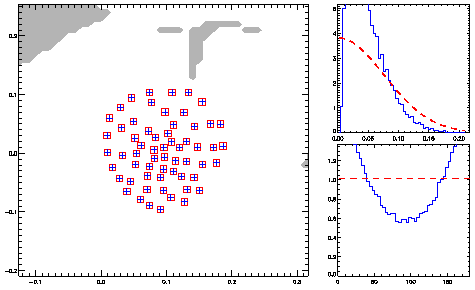
Figure: Optimization of the second compact configuration for 30 deg of elevation. The red squares show
the positions of the pads of the compact configuration. The blue crosses
represent the antenna positions being optimized. The grey areas are the
topographic constraints: regions where the slope is too steep (>5deg).
On the right the radial (top) and azimuthal (bottom) distributions of visibilities
are represented in blue. The dashed red line represents the ideal distribution
the array is optimized for. After some iterations the antennas which are
near an existing pad are fixed on this pad.