 Formation and evolution of galaxies
Detecting molecules in high-z mergers with ALMA |
Formation and evolution of galaxies
-> at high z, more affected
Star formation rate highly underestimated
LIR/LB varies from 0.1 to 1000 !
 |
SED for strong and moderate starbursts, at various redshifts, compared with NGST, FIRST/Herschel and ALMA sensitivities, for 1h integration time (Melchior et al. 2001). |
PRESENT SURVEYS
JCMT-SCUBA, IRAM-MAMBO at 0.850 -1.2 mm
(Smail et al 97, Barger et al 98, Carilli et al 00)
1-2 sources/ arcmin2
above 1 mJy (e.g. Carilli et al. 2001)
 |
Source number counts, for sub-mm sources, from Carilli et al (2001, astro-ph/0009298) |
Problems:
 Identification of sources
Confusion (also SIRTF, ASTRO-F, Herschel)
Contribution of AGN?
How to get redshifts?
By molecular lines (redshift machine)
LMT, GBT, ALMA...
Extinction corrections applied to vis/UV results correspond ( x 3)
|
From Genzel & Cesarsky, 2000 Blue losange = ISO Black squares: without reddening Green squares: After reddening correction, by a factor 3 Red error bars: SCUBA results Blue dashed curve: no ULIRG Red dashed curve: with ULIRG Black full line: CIBR limits, from COBE |
No confusion with ALMA:
spatial resolution better than 0.1"
Possible detection of non ULIRGs
for ex. LBGs: Lyman-Break Galaxies
(Steidel et al 1996, Adelsberger & Steidel 2000)
their density is 150/arcmin2 for z=2.5-3.5
100 times more objects than today
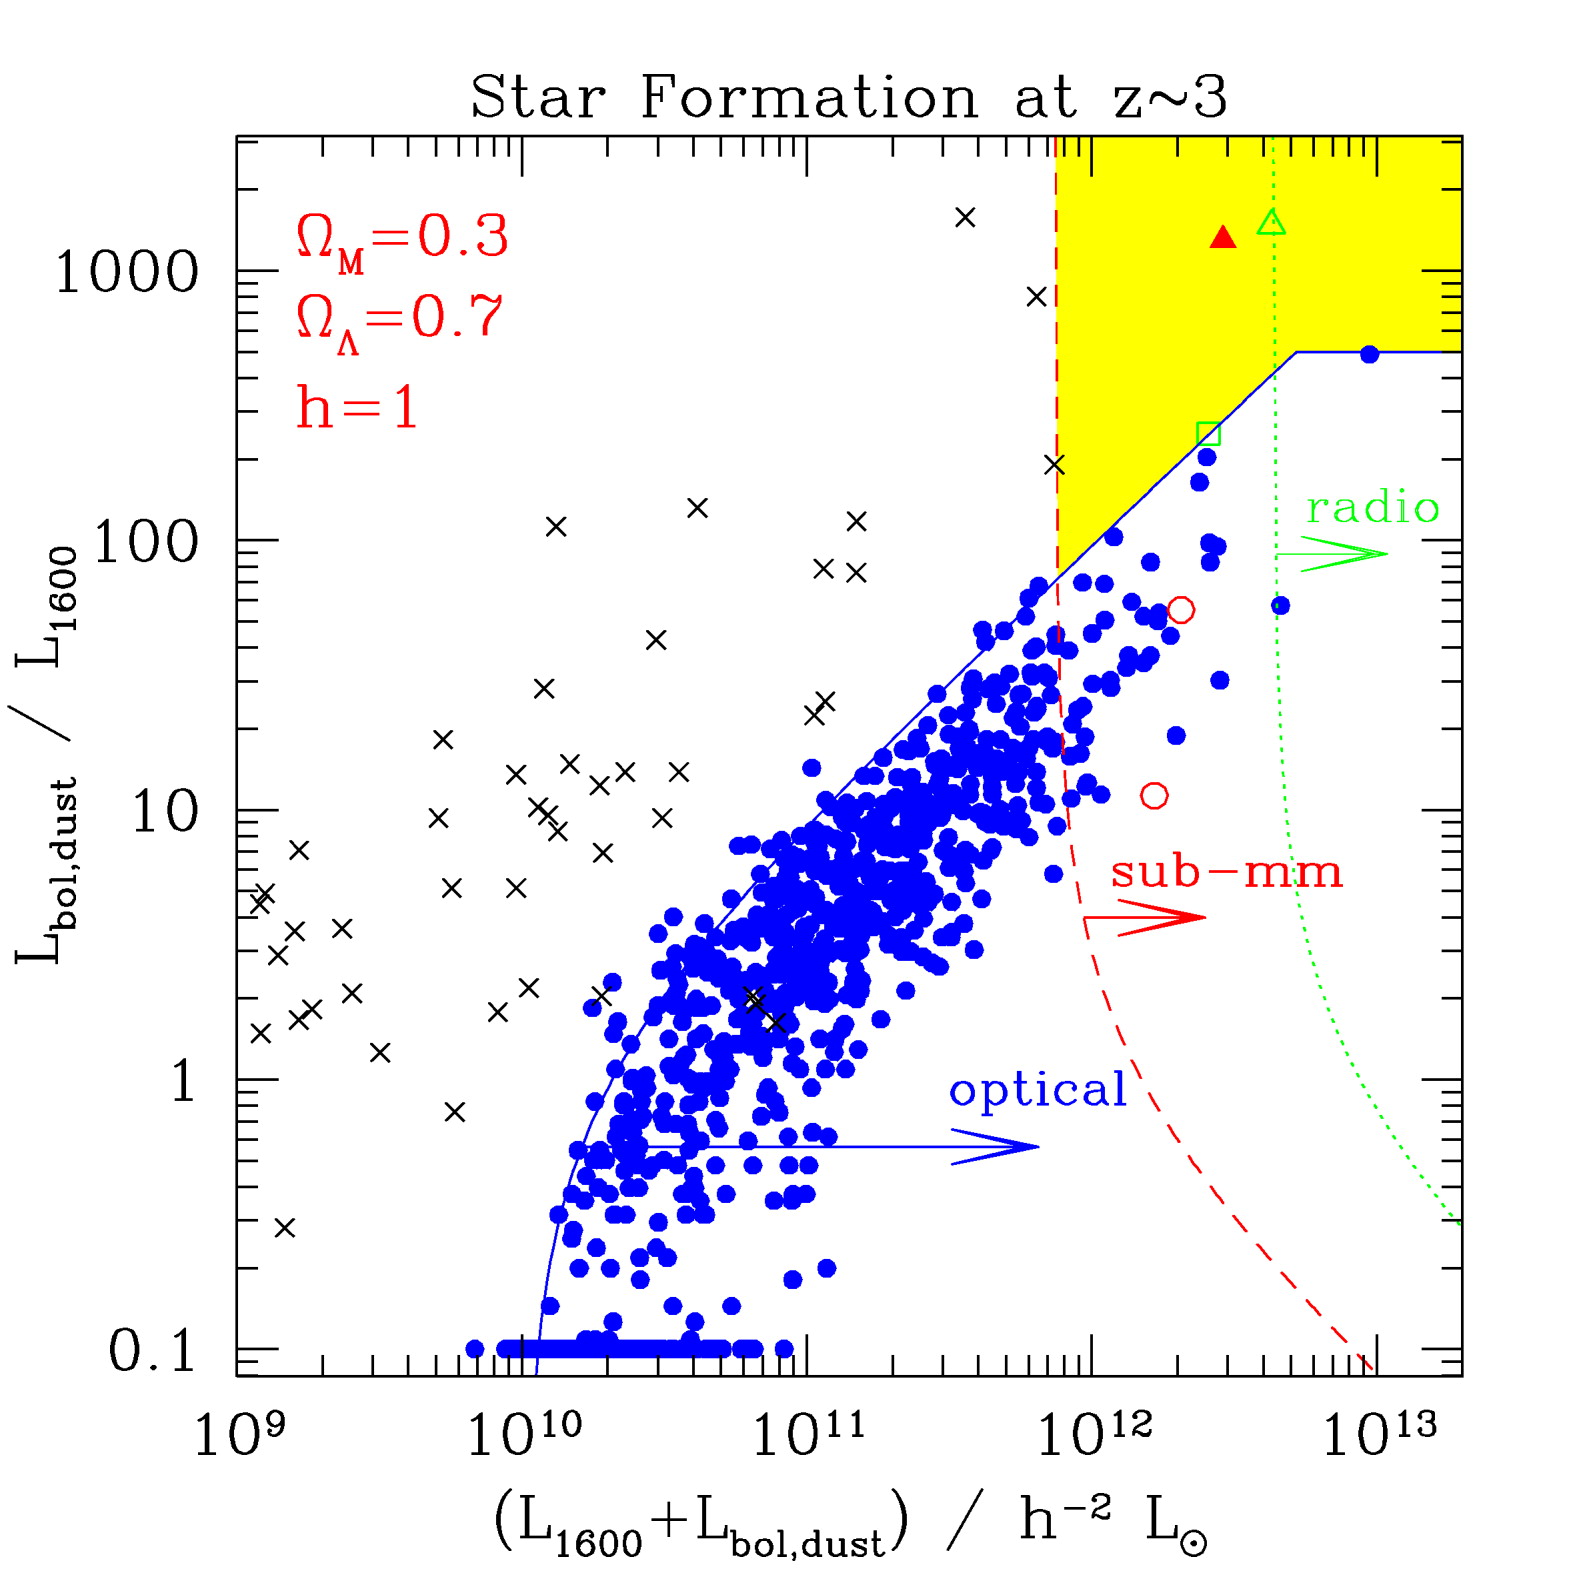 |
Colour-magnitude diagram (from dust emission and 1600 Angstrom luminosity), for starbursts at z=3, from Adelberger & Steidel (2000, ApJ 544, 218). The x-axis can be viewed as the star formation rate, and the y-axis as the obscuration rate. The blue dots are Lyman-break galaxies, the red and green points are detected sub-mm sources. The black crosses are starbursts at z=0, for comparison. The limit of detection for optical sources is the blue full line, for sub-mm sources is the dash-red line, and for radio sources the dot-green line. The yellow region indicates where very obscured sources can only be detected by their sub-mm or radio emission. With ALMA, the dash-red line will shift to the left by 2 orders of magnitude, and all Lyman-break galaxies will be detected. |
Semi-analytic models, based on the hierarchical scenario
Numerous free parameters
Much more efficient at high z
How to know the molecular gas fraction ?
Molecular lines: favored also at high z
but no negative K correction
Highly depend on excitation, density, temperature..
ULIRGs: observed in excited CO lines
J=8-7, 9-8, etc..
| Tel | Area | min wavelength | Resol |
| IRAM-30m | 707 m2 | 1mm | 10" |
| IRAM-PdB | 883 --> 1060m2 | 1mm | 0.5" |
| NRO | 6x10m=509m2 | 1mm | 0.5" |
| OVRO | 6x10m= 509 m2 | 1mm | 0.5" |
| +BIMA | 10x6m=282 m2 | 1mm | 0.5" |
| =CARMA | 791 m2 | 1mm | 0.5" |
| SMA | 7x6m = 200 m2 | 0.3mm | 0.1" |
| GBT | 100m = 7854 m2 | 2.6mm | 7" |
| LMT | 50m = 1963 m2 | 1mm | 6" |
| ALMA | 64x12=7238 m2 | 3-0.3mm | 0.1-0.01" |
| E-VLA | 35x25m=17200m2 | 6mm | 0.004" |
MOLECULES AT HIGH REDSHIFT
First detection: Faint IRAS Source
F10214+4724 at z=2.3
(Brown & van den Bout 1992, Solomon et al 1992)
 |
CO data for high redshift objects |
 |
H2 mass as a function of redshift. Black triangles: normal galaxies. Empty pentagons: ULIRGs. Asterisks: high-z CO-detected objects. Dotted lines: IRAM sensitivity for various CO lines. |
Triggered the search: hyper-luminous objects, quasars..
 15 betwen z= 1.0 and 4.7 (in 2001)
most of them amplified gravitationally
Strategy:
MODELISATION
Starburst modelisation, from z=0 ULIRGs
size 1kpc, mass 6 1010 Mo
2 extreme models:
Assuming the same energy comes from stars
Transfer: LVG model
 |
Result of the LVG model, for the homogeneous case at T=50K. Top: CO lines; Bottom: continuum as a function of redshift. |
Starbursts at high z could be different from ULIRGs at z=0
In particular, the molecular density could be less, and the rotational levels of CO not excited until J=9-10..
| T=50K | T=30K & 90K | |
 |
 |
|
| T=30K | HR10, Papadopoulos & Ivison 2001 | |
 |
 |
Molecular absorption in front of quasars will be also a useful tool to determine the chemistry as a function of z, with ALMA
 |
Several examples of molecular absorption in front of quasars, at various redshift (Wiklind & Combes) |
STARBURST DYNAMICAL SIMULATIONS
Melchior & Combes (2001)
Chemo-dynamical simulations of galaxy collisions at high z
N-body Tree-SPH
with spectral modelisation coupled to dynamics
 |
One of the first simulations, with in green the dark matter, in red the stars, and in blue the gas particules. Three projections are given at each epoch. |
 |
Modelisation of the SED: three types of dust particules are considered PAH, small and big grains A population synthesis model is used from the stars formed in the simulation, their light is absorbed by the gas in the same line of sight, within any resolution eleement, and is re-radiated by the dust (from Melchior et al. 2001). |
Library of merging galaxies:
the missing link, baryons
star-formation and feedback
disks and angular momentum
dynamical friction..
Observations of the objects:
toward predictions for NGST, ALMA, FIRST-HERSCHEL
and before, GBT, LMT..
Continuum and lines
 |
"Observation" of the simulated galaxies at different redshifts. Left with NGST Right with ALMA |
CONCLUSIONS
Opening of the ALMA "window"