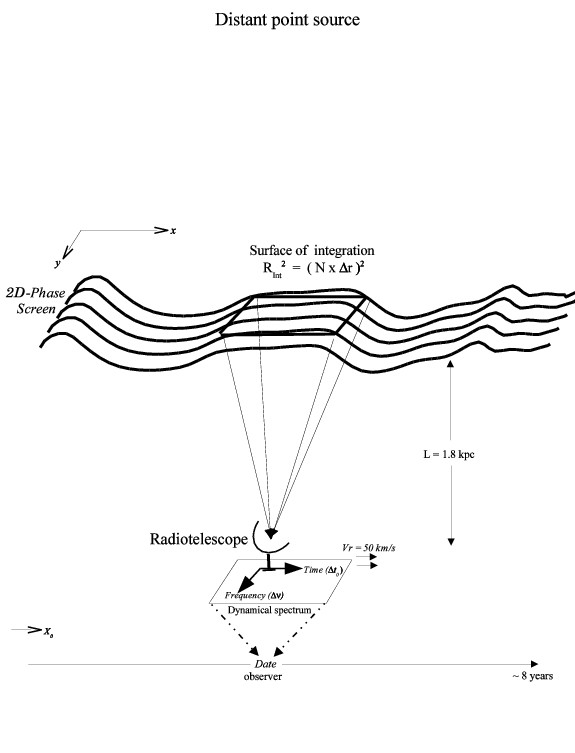
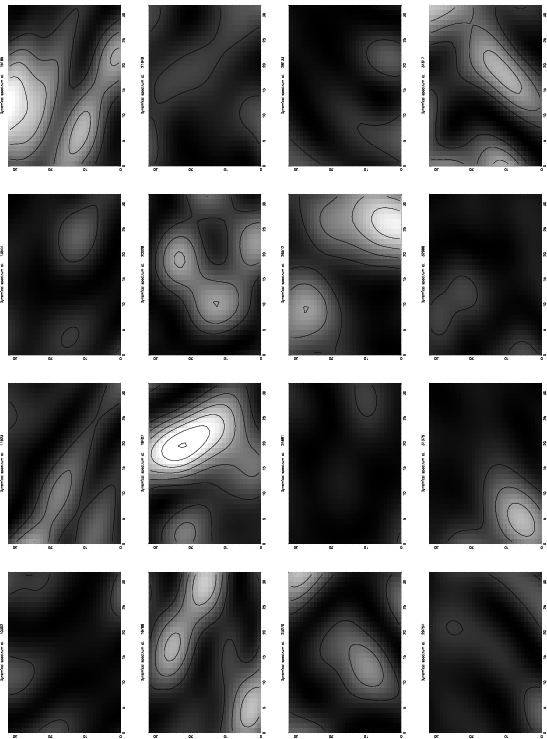
Figure 1:
Series of 16 simulated dynamical spectra (time-frequency domain) of
the pulsar 1937+21 when a turbulent screen
intervenes on the line of sight. Turbulence is characterised by the 3N Kolmogorov power spectrum
P3N(q) =Cn2 q -11/3 with the strength
Cn2 = 10-3 m-20/3, i.e. the coherent length is
2.66 107 m.
The median frequency of these dynamical spectra is 1.41 GHz (lambda=21 cm), their
bandwidth is 8 MHz sampled over 32 channels (horizontal scale)
and the integration time is 70 minutes, when the screen speed is 50 km/s,
sampled over 32 bins (vertical scale).
These 16 dynamical spectra are 2.5 days apart with this screen speed.
The Fresnel scale is 4.8 109 m with the screen placed at
mid-distance to the pulsar (1.8 kpc). In these conditions,
the computation of the phase screen can be reduced to the thin screen
approximation. Each dynamical spectrum
in the observer plane has to be calculated with the
general Fresnel-Kirchhoff integral which was computed numerically
with 1/4 of the coherence length (6.5 106 m)
as the integration step in the screen plane. The surface of
integration over the phase screen is as large as 21916 x 21916 pixels
and the oberver plane is as large as 32 frequency-channels x 32
time-bins as already mentioned. The
pulsar is assumed a point source. Note that all 16 spectra
are displayed here with the same intensity scale. The "speckles"
in these dynamical spectra have mean sizes of 9 minutes
and 0.75 MHz comparable to the values observed (6.2 minutes and 0.56 MHz)
for 1937+21 at 1.41 GHz by Ryba (1991, PhD Dissertation, p.58)
|


